HIOKI · MEASUREMENT PLANNING
Short answer: A data centre cooling measurement plan starts with the decision to be made, then maps electrical, thermal and mechanical signals to the relevant equipment. Measure rack and cooling distribution unit power with temperature, capture drive events when troubleshooting, and assess power quality or conversion efficiency when those are the issue.
- Define the operating boundary and measurement objective.
- Match each signal to the required channels, sensors and recording speed.
- Compare results using a shared or aligned timeline.
Reliable cooling depends on more than one temperature reading. Server racks, cooling distribution units (CDUs), pumps, chillers and their electrical supply respond differently as computing loads and operating conditions change.
A useful plan connects the instrument to the question: whether a team is developing cooling equipment, commissioning a system, evaluating energy use or investigating an intermittent event. The correct measurement points and time scale are as important as the recorder itself.
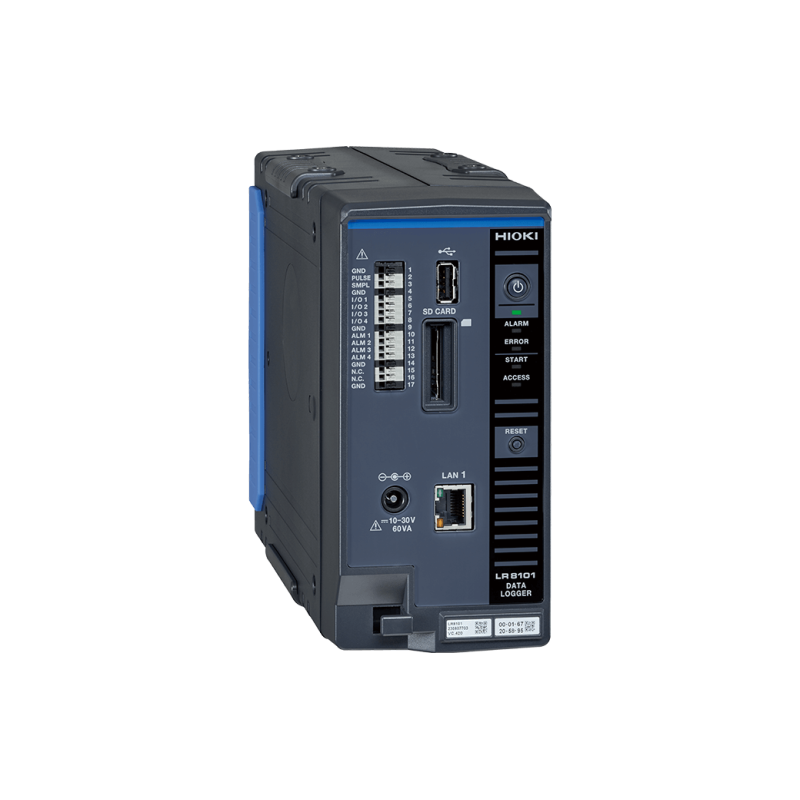
HIOKI LR8102 Data Logger
Match the measurement to the problem
| Objective |
Signals to plan |
RCCE product option |
| Relate rack or CDU load to thermal response |
Power and multi-point temperature |
LR8102 with M7103 and M7102 modules |
| Investigate pump or chiller drive events |
Voltage, current and relevant control or transducer signals |
MR6000-01 Memory HiCorder with appropriate inputs and sensors |
| Investigate supply disturbances |
Voltage events, harmonics and power-quality trends |
PQ3198 Power Quality Analyzer |
| Evaluate conversion efficiency and losses |
Input and output power at defined boundaries |
PW4001-02 Power Analyzer with compatible current sensors |
Measure rack and CDU power with temperature
Record electrical load and temperatures at chosen rack or CDU points on a common timeline. A load change can precede a slower thermal response, so a time-aligned record helps engineers observe lag, cycling and differences between operating conditions.
The LR8102 can be configured with M7103 power and M7102 voltage/temperature modules. First map the circuits and temperature points, then confirm voltage, current sensors, channel count, thermocouples and recording interval. Temperature placement must represent the question being studied, not just the easiest installation point.
Capture pump and chiller drive events
When a drive trips or a pump behaves intermittently, record relevant voltage and current waveforms together with available control, pressure or vibration signals. A high-speed recorder can provide evidence around the event; temperature and pressure trends can add context over a longer period.
Select input modules and probes for the actual circuit and desired bandwidth. Configure triggering and pre-event recording so the data includes conditions before the symptom. Correlation can guide an investigation, but it does not establish a root cause by itself.
Separate power quality from equipment efficiency
Power quality work examines the supply and electrical events, including voltage fluctuations and harmonics. An analyzer such as the PQ3198 can record relevant disturbances during commissioning or troubleshooting.
Efficiency work compares electrical power entering and leaving a defined conversion stage. A power analyzer such as the PW4001-02 can support such measurements with suitable current sensors. Confirm the measurement boundary, channel configuration, bandwidth and accuracy required; an energy trend and a detailed conversion-efficiency test answer different questions.
Build the plan before selecting equipment
- Define the decision, equipment boundary and operating modes.
- Map electrical circuits, thermal points and any mechanical or control signals.
- Document expected ranges, conductor access, isolation requirements and sensor locations.
- Choose sampling and recording duration for both fast events and slower thermal changes.
- Align time references, record a baseline and document changes in load or control settings.
- Review data together and confirm that the results answer the original question.
Configuration support in Canada
RCC Electronics can review a cooling measurement plan with Canadian data centre teams, equipment developers and commissioning specialists. Share circuit voltage and current, signal types, temperature point count, installation constraints, event duration and the measurement objective so the recorder, modules, probes and sensors can be considered as a complete system.
FAQ: Cooling-system measurement planning
Is one room temperature sufficient?
It may miss local conditions. Choose points that represent the equipment and thermal path being investigated.
Why align power and temperature data?
It allows a load change to be compared with the thermal response that follows.
When is a waveform recorder useful?
When an intermittent event or a fast drive signal needs more detail than a slow operating trend can provide.
Is power quality the same as efficiency?
No. Power quality concerns supply characteristics and disturbances; efficiency compares useful output and input within a defined boundary.
What should be specified before ordering?
Confirm ranges, channels, sensors, required recording speed, safety ratings and accessories for the actual installation.
* Based on manufacturer-published application information. Confirm current specifications, safety ratings and the complete configuration before selection.